SCIENCE
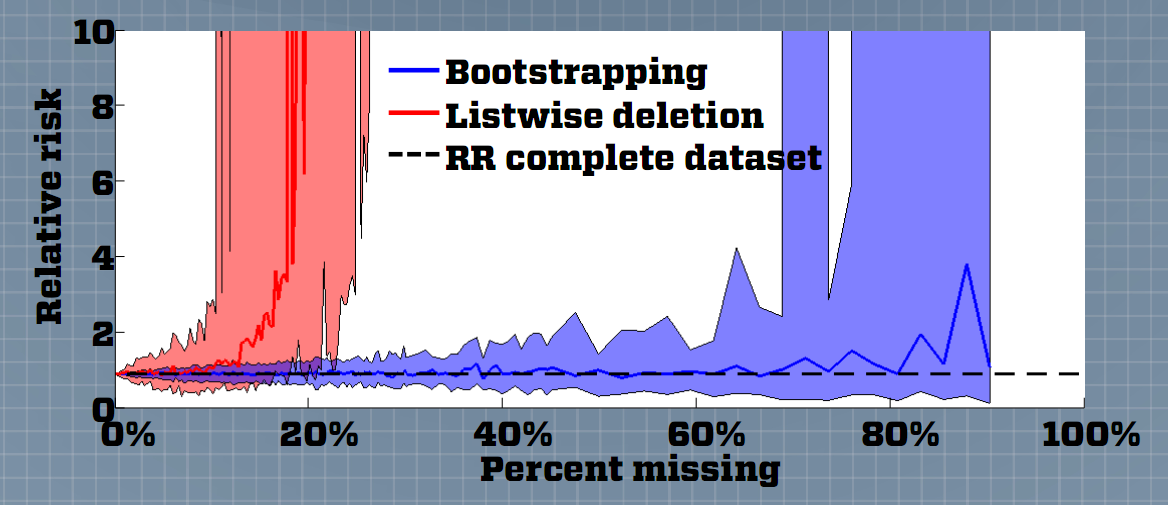
Bias Reduction in Statistical Analyses of Incomplete Data Sets
Prototype software for epidemiologists that computes robust statistics even when data is missing, poster ISDS
2012
Performance Measures for Improved Submarine Decision Making (2012)
Exploring human error in an RPA target detection task (HFES 2012)
Calibrating Interpersonal Trust in Networked Teams (APA 2012)
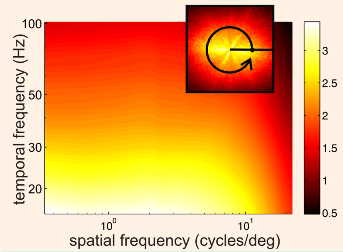
Frequency content of the retinal stimulus during active fixation
At BU I worked with Dr. Michele Rucci in the Active Perception Lab
studying the effect of small eye movements on the power spectrum of input to the retina. My work was presented at at the 2010 Vision Sciences
Society Meeting, see the poster
here.
Google TechTalk: Googlewhacks for fun and profit
I gave a TechTalk to Google about my Internet and quantitative linguistics research 2008
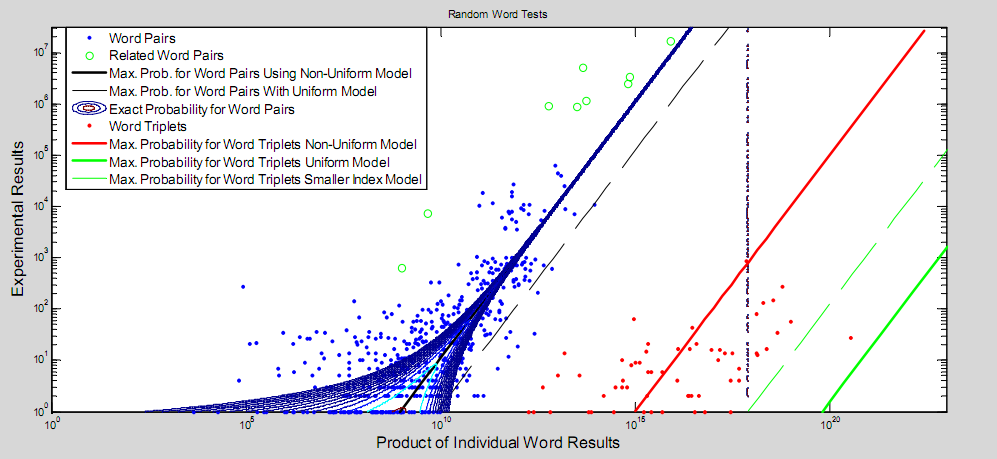
Internet search result probabilities, Heaps’ law and word associativity
The paper (pdf) written with Dr. Bruce Bukiet has been published in The Journal of Quantitative Linguistics 2009, Vol. 16.
I also presented a poster (pdf)
at the NJIT Applied and
Computational
Mathematics Conference (2006). The data from this work is published
here.
Evidence, coincidence, and superabundant information
Maurice Lee from the BU English department applied my Googlewhack research to Google books in order to find out if Ahab was related to slavery around the time Moby Dick was published.
The Free-for-All Effect: A mechanism for drastically fluctuating rates of evolution
In the summers of 2006 and 2007 I worked with Dr. Chris Adami at the Keck Graduate Institute in Claremont CA. My research regarding computational evolution used the software Avida. We are collaborated with Dr. Rich Lenski's lab in Michigan.
Mathematical modeling of invasive species
In the Spring, Summer and Fall of 2005 I participated in a Math Biology Training Program UBMTP, I gave a short talk on my work at an Mathematical Biology Seminar in January 2006. We displayed a poster (PPT) at the annual meeting of The Ecological Society of America. My partner and I have also drafted a paper but I do not expect it to be published.
ART
Harmonograph
The Art and Science of Spirals by Victor Dorff includes a
copy of a drawing, created with a single pendulum harmonograph
I designed.
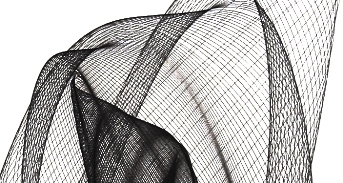
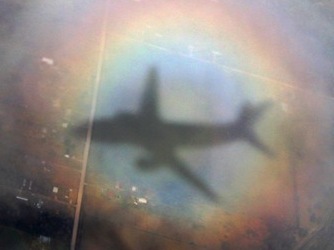
Photo of a glory
Displayed in the atmosphere exposed exhibit at the
National Science Foundation Jan-Mar 2012 and the
Boyden Gallery Jun-Sep, 2010.
The photo has also graced the cover of a
physics journal. Read about glories
here.
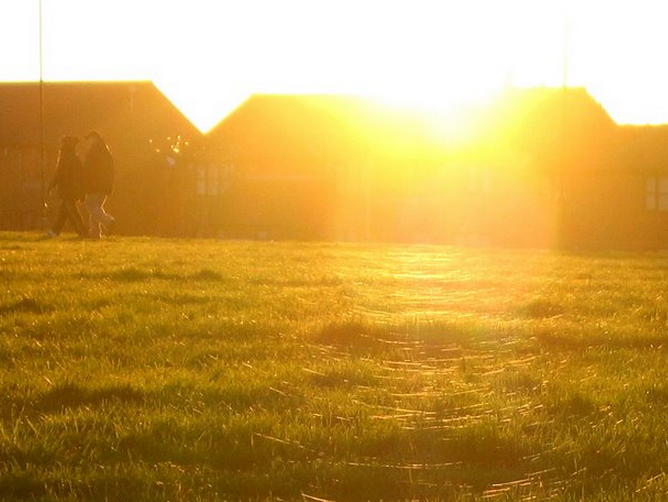
Ringed glint
My picture of a ringed glint became the optics picture of the day on Atmosphere Optics.
OTHER
Lifehacker toothpaste trick
My trick to
get the most out of your toothpaste was picked up by
lifehacker.
![]()
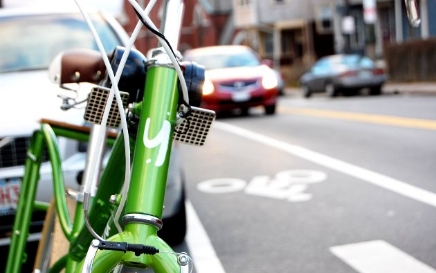
Safer Cycling: A Car Horn for Your Bike
An article in
Good
Magazine, covering about my company Loud Bicycle. The horn
was also featured in
Wired magazine,
The Huffington Post,
BoingBoing,
Core77,
Laughing Squid, and
Yahoo news.
Rethinking a lot
My picture of a grave in a parking lot was included in the book rethinking a lot
MATLAB
I am active in the MATLAB Central community where my programs are downloaded by hundreds of people each month. I rank among the top 2% of MATLAB Central contributors (as of July 2013). I talk about the functions in more detail on my site here, and you can jump to my author page here.
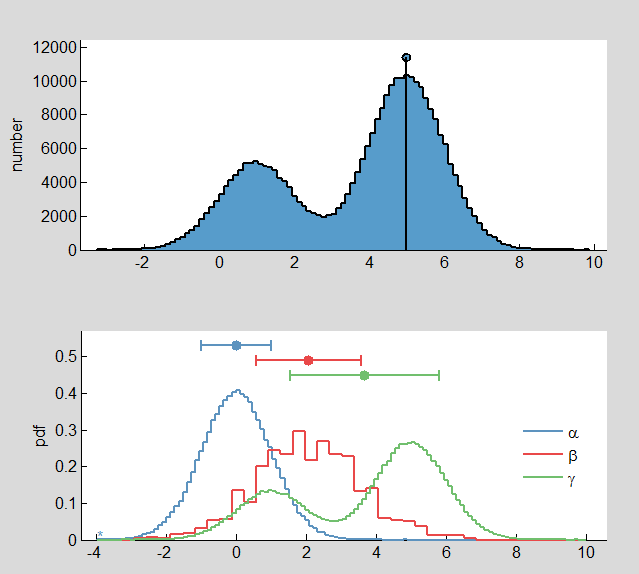 Plot and compare nice histograms by default
The default histogram function for MATLAB requires a lot of tweaking to create a visually appealing figure. This function automatically chooses bins and axis bounds to be appropriate for the data and creates an appealing graph. It can also compare multiple sets of data as shown on the right.
Power Law, Exponential and Logarithmic Fit
When given a list of (x,y) points in a curve or distribution, this function will find and plot the best linear, exponential, logarithmic or power law fit for the data. You can see an example of this function's use in my analysis of the growing Awesome Foundation.
Create Healthy Looking Error Bars
By default MATLAB plots a spindly blue wisp of an error bar instead of what you might typically find in a publication. In my lab people photoshopping their errorbars to look prettier (not to change the results :) so I wrote a program that plots nice error bars as the default. My function also automatically places errorbars on group bar plots in addition to some other features.
Mercator Map Projection
Computes the Mercator map projection, and the inverse projection.