A chart made of the things it counts
Pebble Chart: Small Pictures, Big Numbers
What if you could just see the quantity on a bar chart? Take twenty dollars, for example; it is worth about 18 euro or 3,156 yen. The new "Pebble Chart" puts these numbers on a log scale base 1.1, and also contains a visual marker for every item it counts.
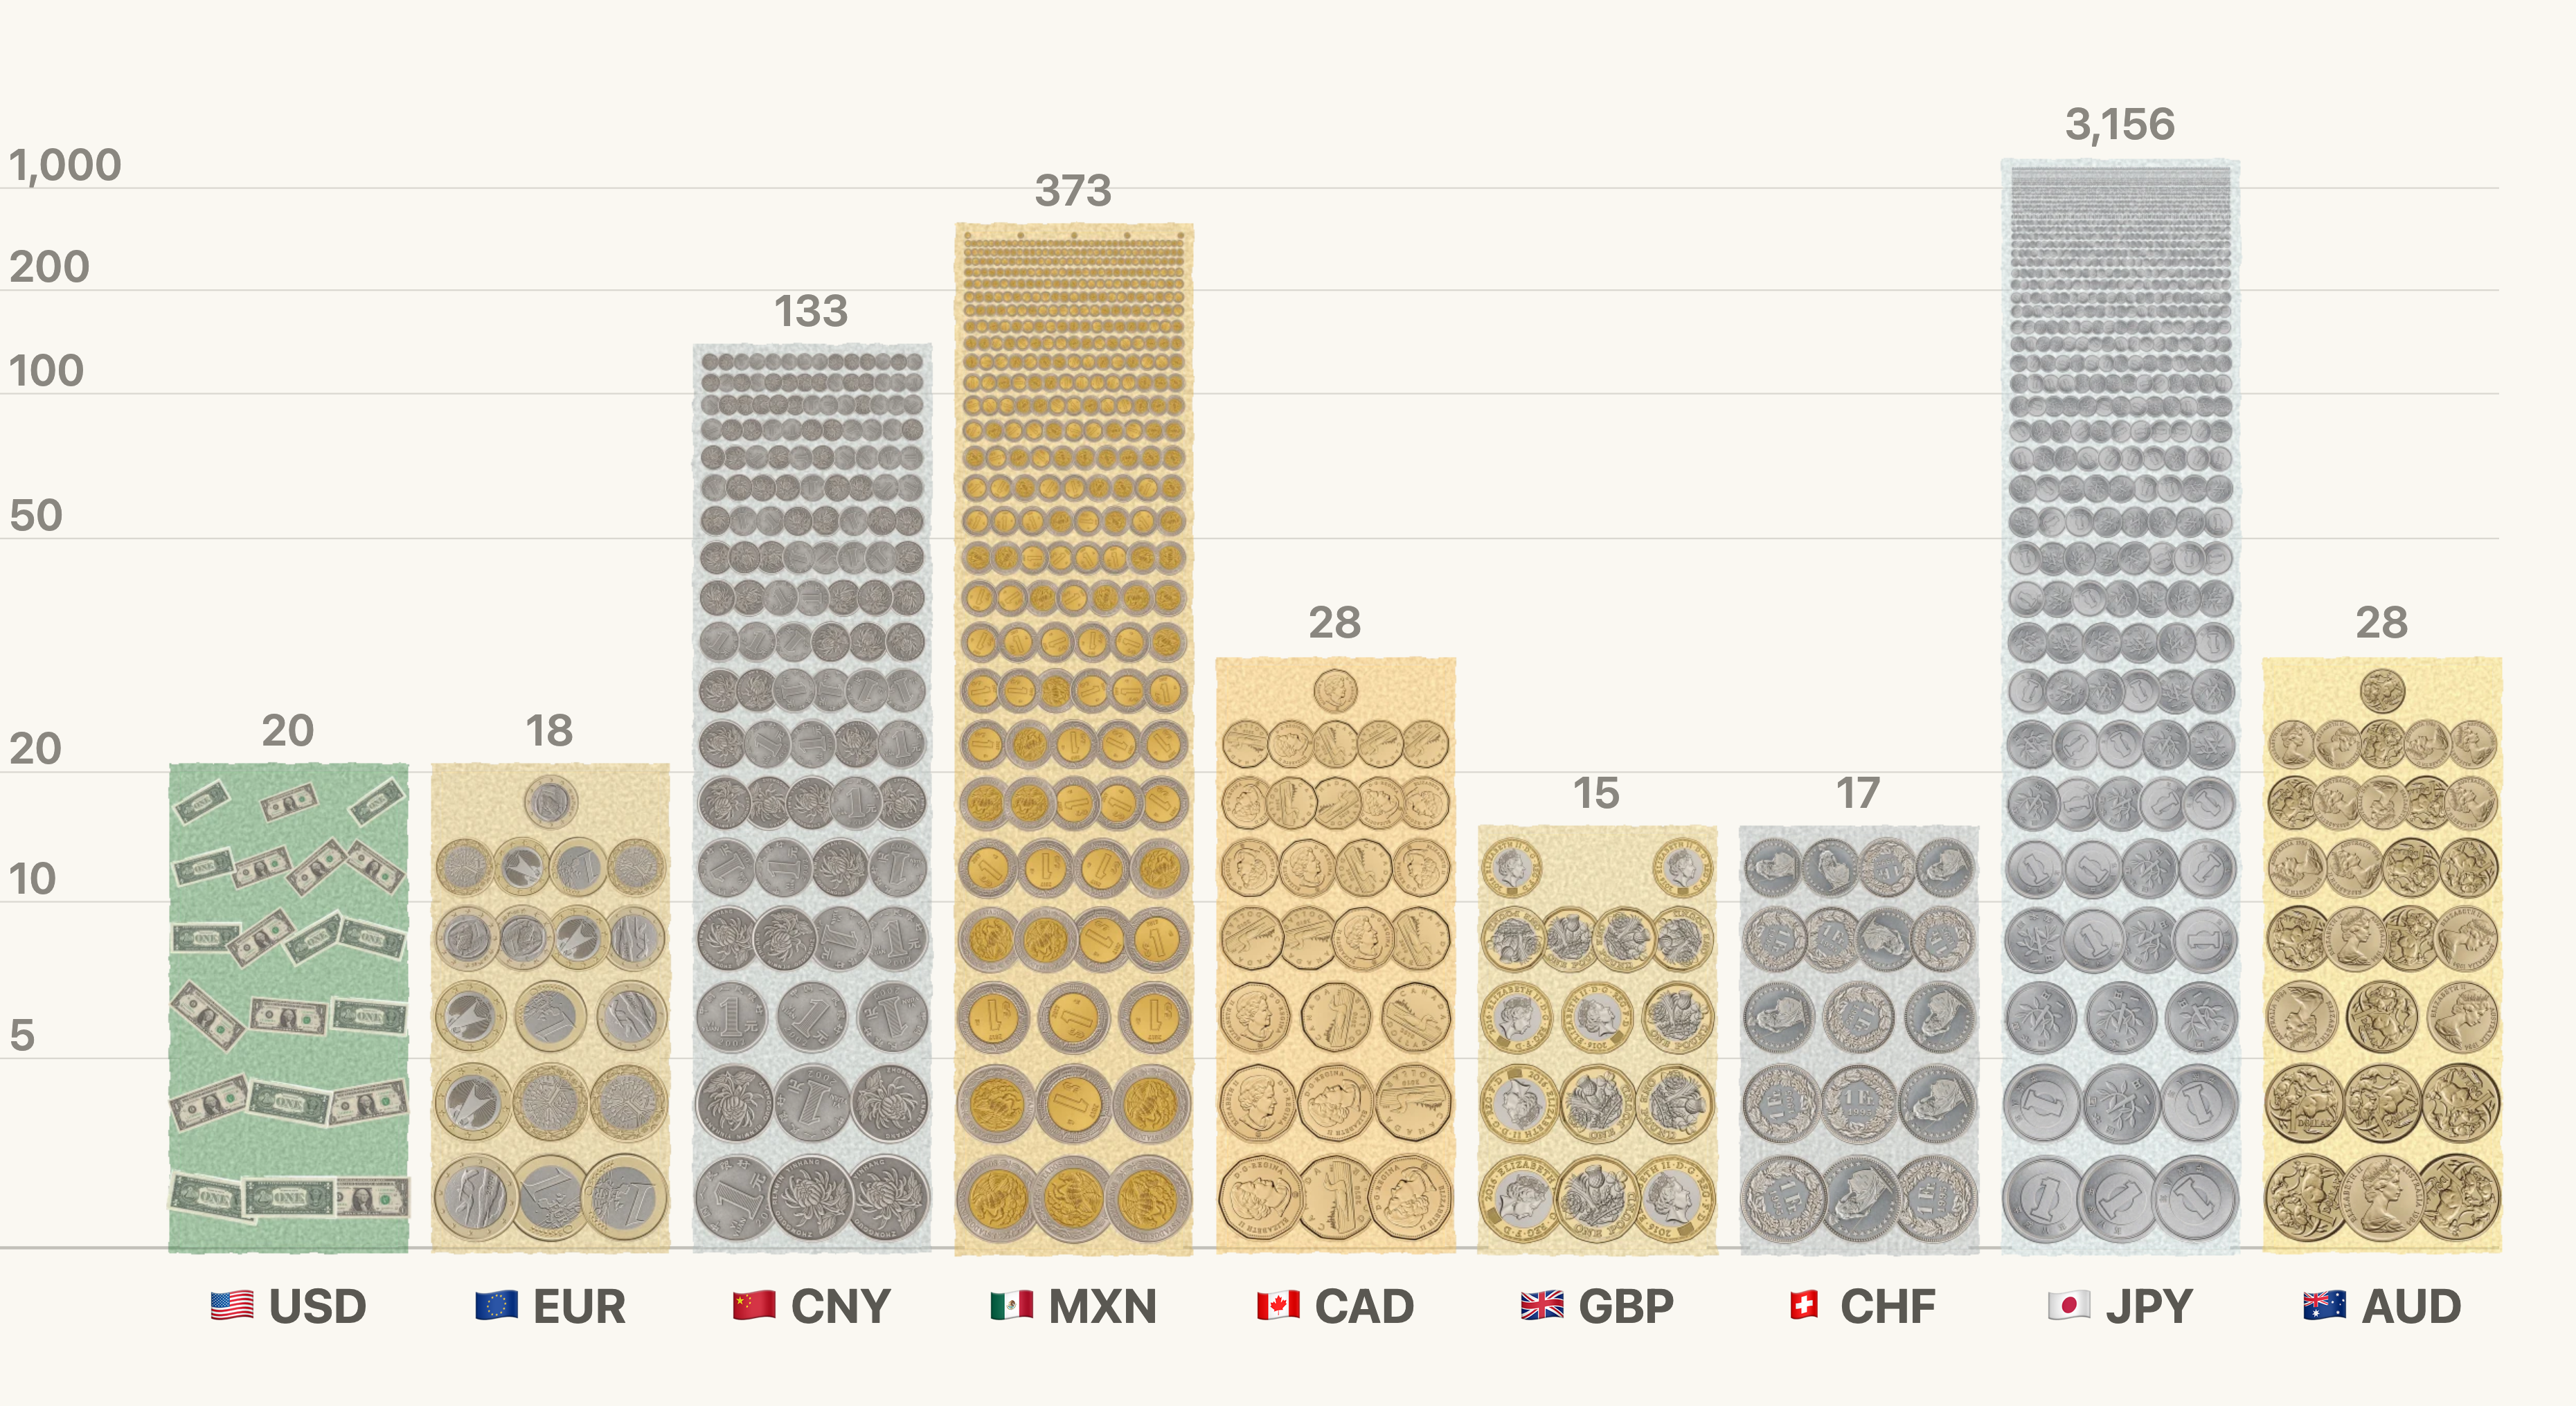
Design options for the log scale
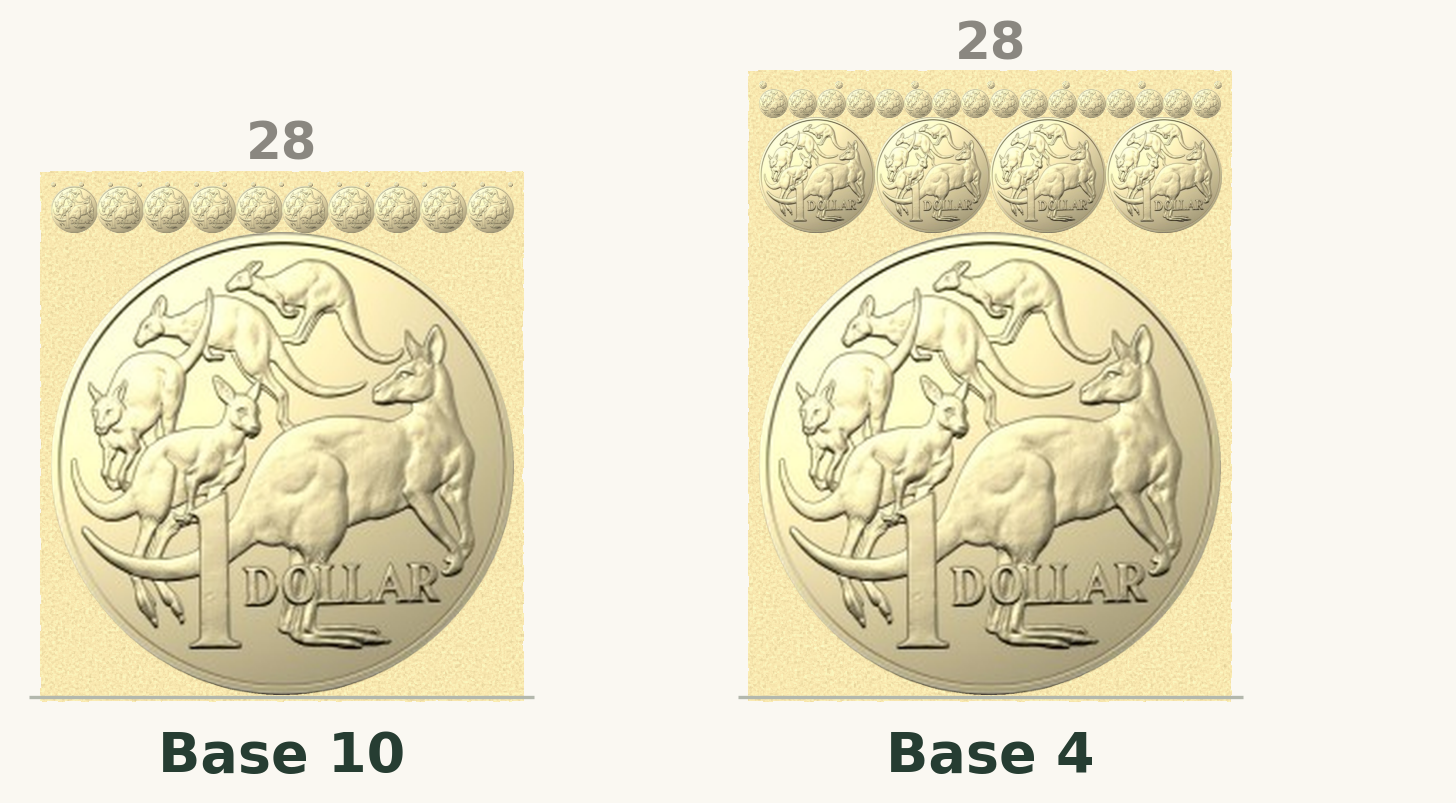
Base 10 grows far too fast. The second row already holds ten pictures at a tenth of the size, and the third row has room for a hundred at a hundredth, though we only have seventeen coins left for it.
Base 4 is the case where the items fit perfectly, one, four, sixteen, each row exactly four times as many pictures at a quarter of the size, so every row fits neatly. But it still grows too quickly. The fourth row has room for 64, and we only have seven coins left for it.
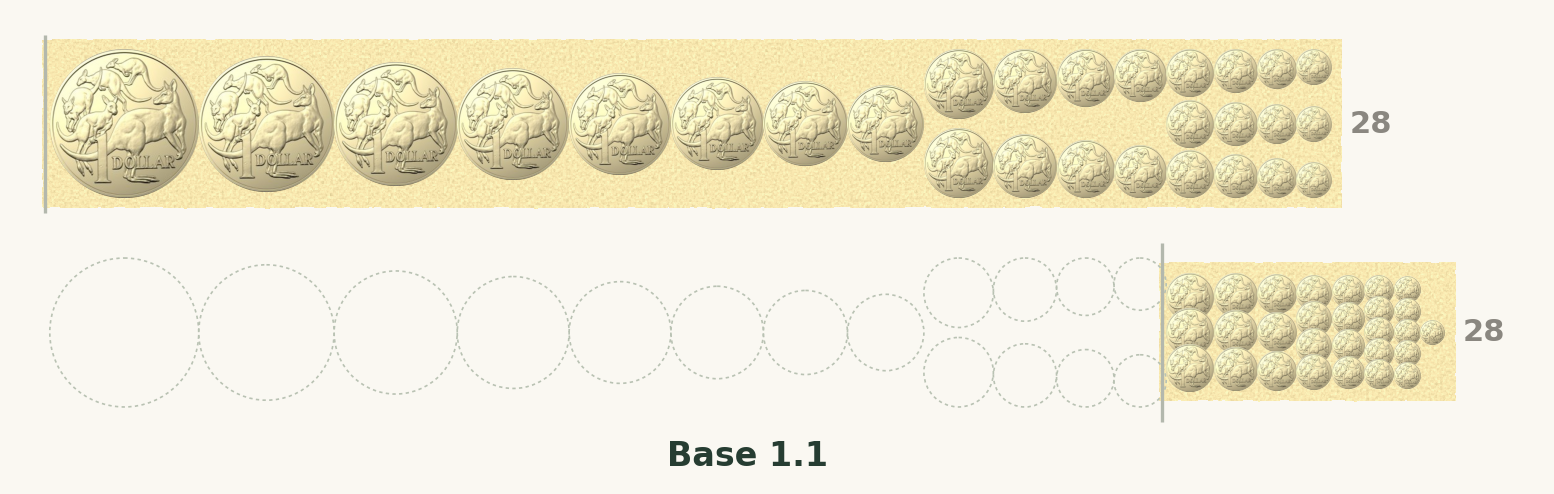
Base 1.1 grows gently, so the pictures shrink gradually. Used naively (top) it starts with a long run of rows holding a single coin and builds a very long pile.
By skipping the early rows (bottom) and squeezing the remaining columns together to 0.7 of their width, we get a more visually useful chart.
When every picture is different
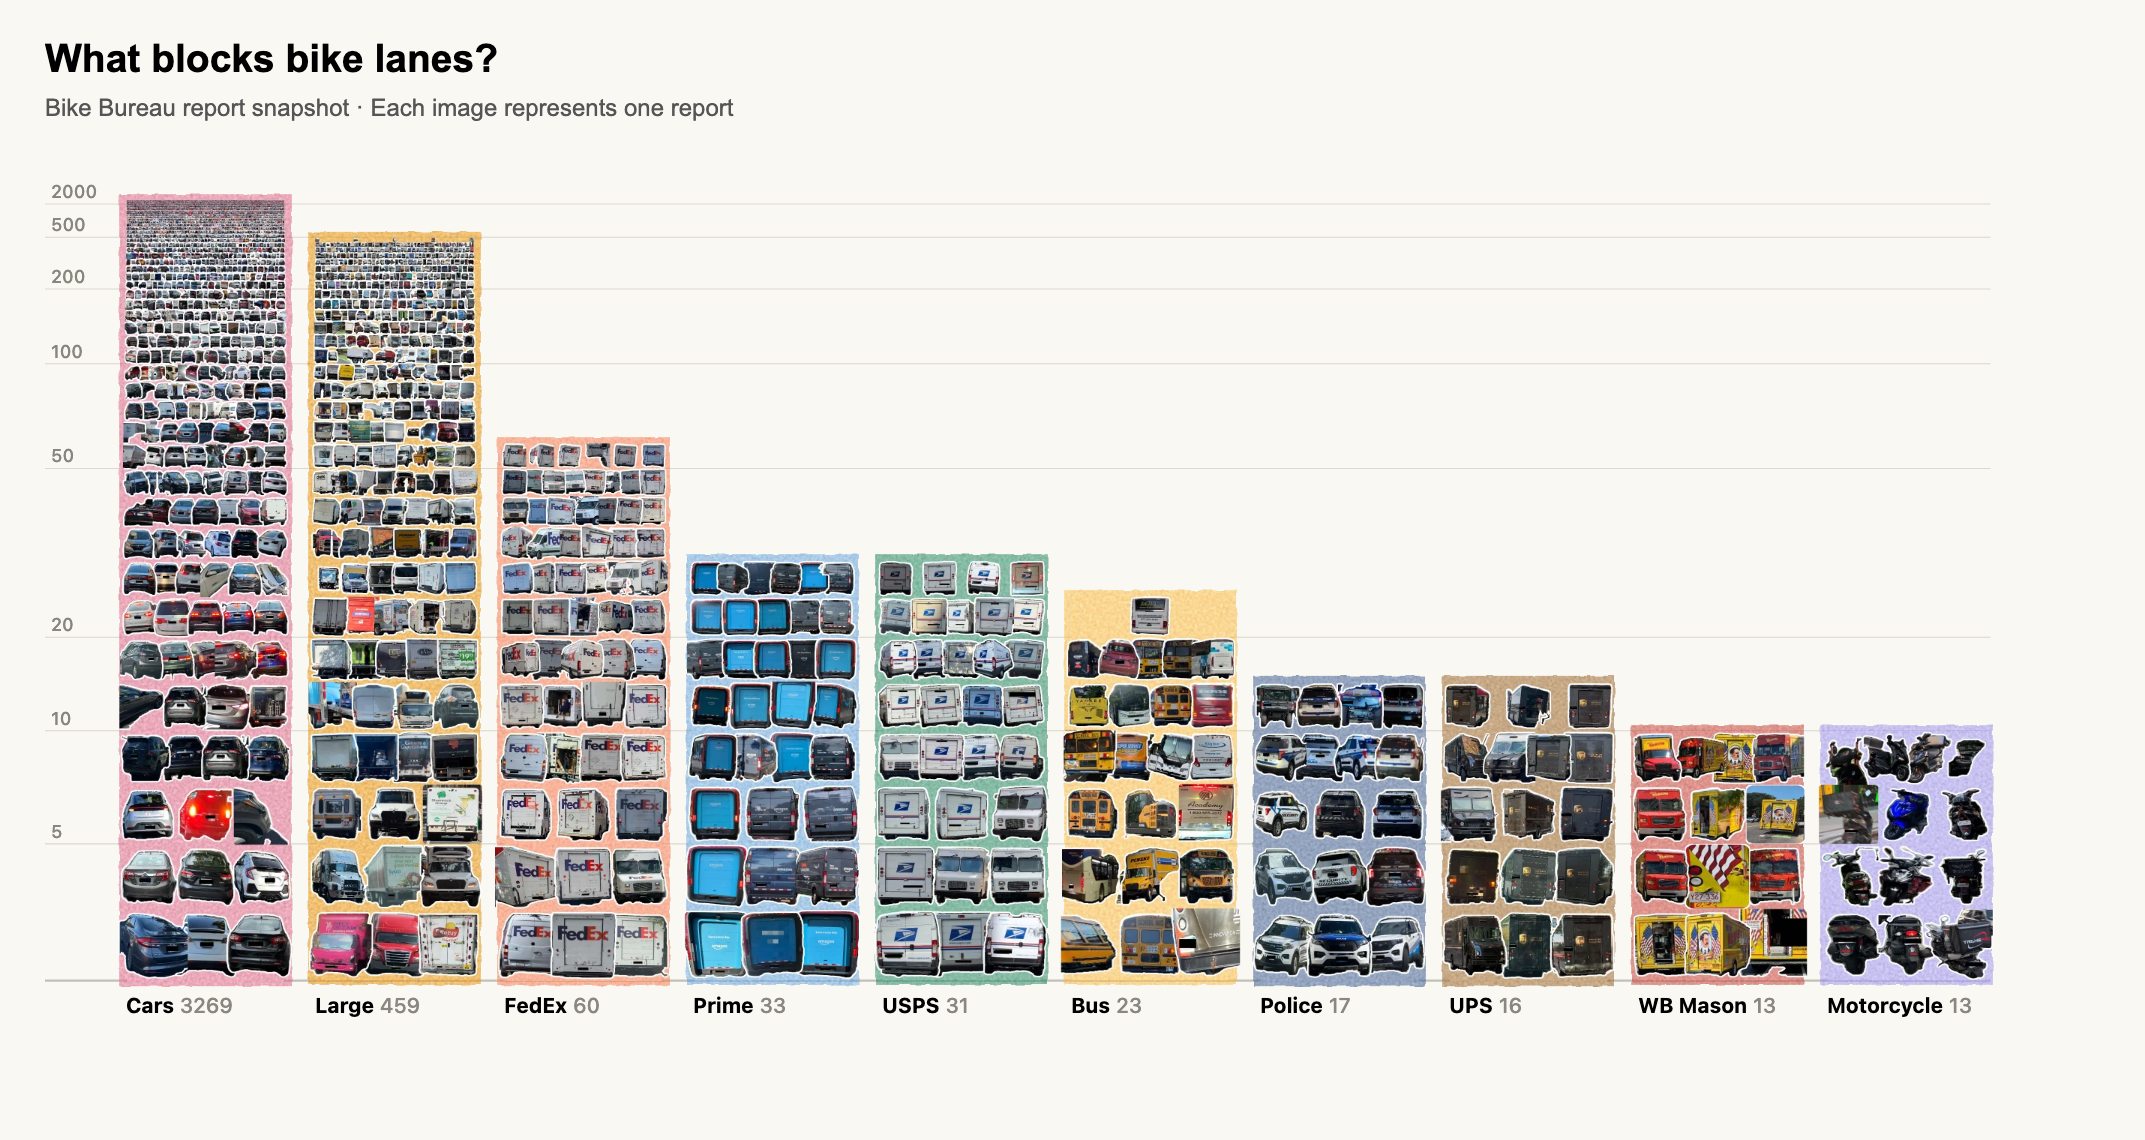
In the currency chart above, a small set of front and back images were repeated, with random rotations. But every picture can actually be its own unique item. In the example below we show reports of people parking in bike lanes via Bike Bureau and the items show a photo of the actual vehicle counting towards the total. Clicking any item will bring you to the full report.
Technical details
How the pictures fit
Each element is a picture in a square area, padded transparently to keep its proportions.
1. Size
Each row’s elements are smaller than the row below, so more fit across. At α = 1.1 they shrink to about 91% per row. Rows fill from the bottom; the last may be incomplete.
2. Vertical position
Stack the visible rows upward from the baseline, each as tall as its elements. The same sum gives the column height and places the count ticks. So the height of each bar can be slightly higher than the true height.
3. Horizontal position
Spread each row’s spare width equally between its elements, then squeeze their centers toward the column’s center so they overlap without distortion.
Equations
W: column width, in pixels.
r: row number, 0 at the bottom; r0 is the first visible row.
α: growth factor; here 1.1.
sr: element width and height in row r.
cr: elements that fit in row r.
B: baseline.
yr: top of row r.
k: elements placed in the row.
g: spare width between neighbors before squeezing (a lone element is centered).
x, x′: an element’s horizontal distance from the column center, before and after squeezing.
q: squeeze factor; 0.7 moves centers 30% closer.
Pre-rendering and click mapping
The browser never lays out thousands of separate pictures. Python does all the drawing ahead of time: each category’s pile is rendered once into a single image, so the page loads only a handful of files, one per bar, however many pictures each pile holds.
Alongside each image goes a small location table: for every row, its top, its element size, how many columns it has, the index of its first item, and where its columns start and how far apart they are. Hovering or clicking turns the pointer position into an item by location alone. Find the row from the vertical position (a binary search), then work out the column from the horizontal position, checking the neighboring columns because squeezed elements overlap. No per-picture handlers or hit regions are needed.
Only the item under the pointer gets a real, invisible link or button laid over it, so the original photograph loads only when someone clicks.
Build one
The Pebble Chart code is open sourced as part of the matviz python package. Here is an example where the images are stored in a 'cutouts' folder:
from pathlib import Path
from matviz import pebble_bar_chart

categories = [
    {"name": name, "label": name, "color": color,
     "items": [{"id": p.stem, "src": str(p)}
               for p in sorted(Path(folder).glob("*.png"))]}
    for name, color, folder in [
        ("Pink flowers", "#a65b7d", "cutouts/pink"),
        ("Brown flowers", "#927452", "cutouts/brown"),
    ]
]

pebble_bar_chart(
    categories, "collection.html",
    bar_width=150, log_base=1.1,
    item_offset=16, h_squeeze=0.7,
    show_count=True,
)
Python renders each column as one image, downsampling from a larger render to retain the smallest marks. The browser uses saved row geometry to link pictures to their source records.
A log scale you can see
Log scales are a big help to experts and a trap for everyone else. Early in the COVID pandemic, a survey found that most people couldn't answer simple questions about a chart of COVID deaths once it was drawn on a log axis1. The trouble is that a log axis hides how big the numbers are. The yen bar is only about twice as tall as the dollar bar, even though it stands for about 160 times as many things.
A pebble chart keeps that compression but stops hiding it. As a pile grows, its pieces shrink, so you can watch the scale squeeze. Twenty big bills sit on one side and a tall drift of tiny coins on the other. You don't need to know what a logarithm is to see that the second pile holds far more. The height gives the expert their log scale, and the pieces show the beginner what that scale has done to the numbers. One chart serves both readers.
The pictures do a second job, too. In the vehicle chart you get the gist before reading a single label: you can see what kinds of vehicles end up in bike lanes, not just how many. And every picture is a piece of evidence. A plain bar asks you to trust whoever drew it, but a pebble chart shows its work, down to the individual report you can click open and check for yourself.