JONATHAN LANSEY


Analysis of a single pendulum harmonograph

Summary:

An apparatus to draw to graph Lissajous Figures, with damping. After a short push, a barbell hanging from a ladder would swing around and around for 10 minutes with the a pen drawing on the paper. Since I understood what was going on, I could change certain things to get different looking graphs.  In the end, I put the equations on paper and graphed them on a computer. I made it in my dorm room in 2003 so the audio-visual elements here aren't the greatest.


Jump to:

Introduction, Basic AnalysisAnalog Output, Digital Graphs, Pictures of the Apparatus.

Complete List of Materials:

  • pen and paper
  • strings
  • 45 kg of weights
  • a ladder
  • tape
  • paper clips
  • thermometer.

Motivation:

I tried to emulate an apparatus I saw at the "Exploratorium" at The Museum of Natural History (NYC). At the end, my apparatus surpassed the exhibit's both in magnitude and flexibility.


Click for larger Version.


02/01/2009- "The Art and Science of Spirals" a Barnes and Nobles book by Victor Dorff includes a copy of a drawing made by this harmonograph. The book is cheap and includes a spirograph set, see it here.


Lindsey from FilthWizardry did a great job repeating this experiment for her kids. She blogged about it here.

Introduction:

I mathematically describe the motion of an experimental two stringed pendulum.  Graphs were drawn mechanically with a pen attached an actual pendulum.  The pendulum’s motion can be approximated as complex harmonic motion with linear damping.  Similar graphs were first made by Jules Antoine Lissajous in the 19th century, but required a bulky harmonograph (a complicated device with multiple connected pendulums).  My apparatus is simpler with only one pendulum, while an added degree of freedom allows for more interesting output.  Different parameter combinations were tested, and the results modeled with equations.

I first recognized this type of motion in a hanging bench swing but it is present to a small degree in almost everything that hangs on two strings.  After seeing a double pendulum harmonograph at The Museum of Natural History (in the visiting exhibit The Exploratorium) I decided to build my own. After a few trial versions, my apparatus ended up surpassing the original exhibit in detail and flexibility.

Apparatus

  • A short barbell with removable weights totaling 45 kg (about 100 pounds) hung from a ladder by equal strings tied at each end of the barbell.
  • A pen is loosely held on one end of the barbell by two paper clip rings allowing the pen to slide vertically (to compensate for changing distance to the paper underneath as the pendulum swings).  The thermometer also measured room temperature.

Conceptual Analysis:

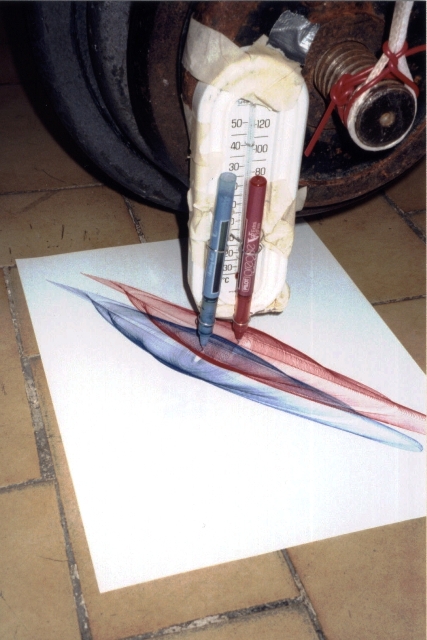
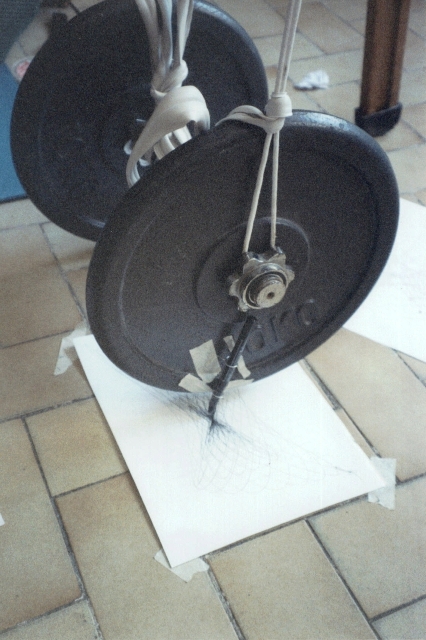
When the pendulum swings in a direction perpendicular to the barbell, as shown in the middle graphic below (and with the green arrows in the graphic at the right), the effective radius for measuring period is the red 
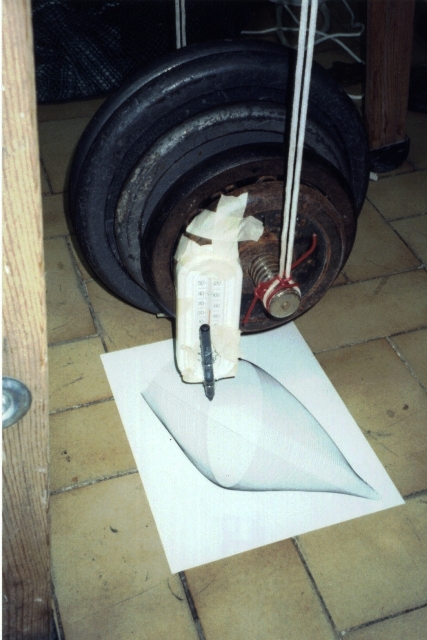
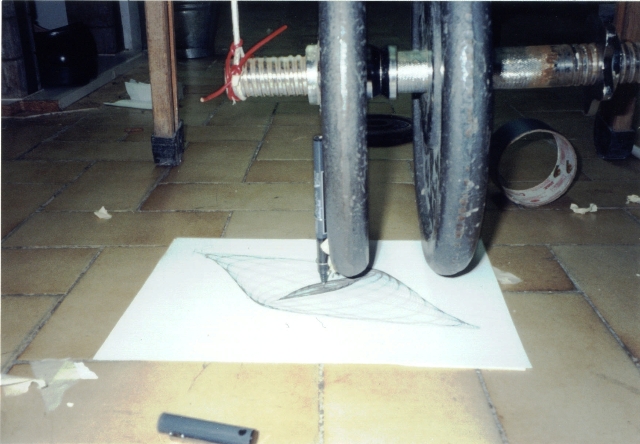
point (center of mass).When the pendulum swings parallel to the barbell as shown in the left graphic (and with the red arrows in graphic at the right), the effective radius is the distance to the point where the string is tied.  These two different radii result in two different values for period, one for the x component and one for the y component.
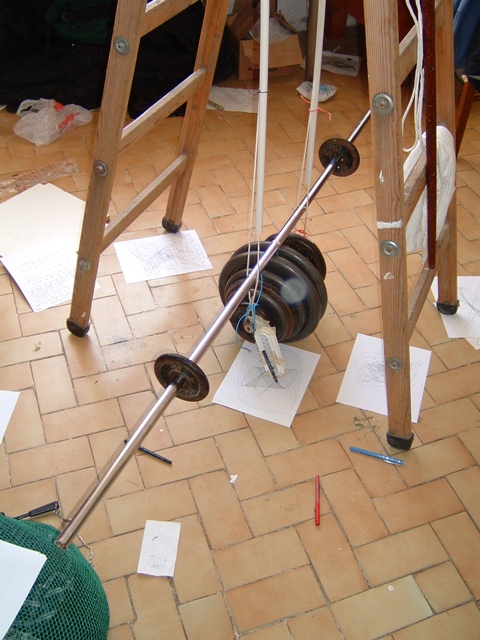
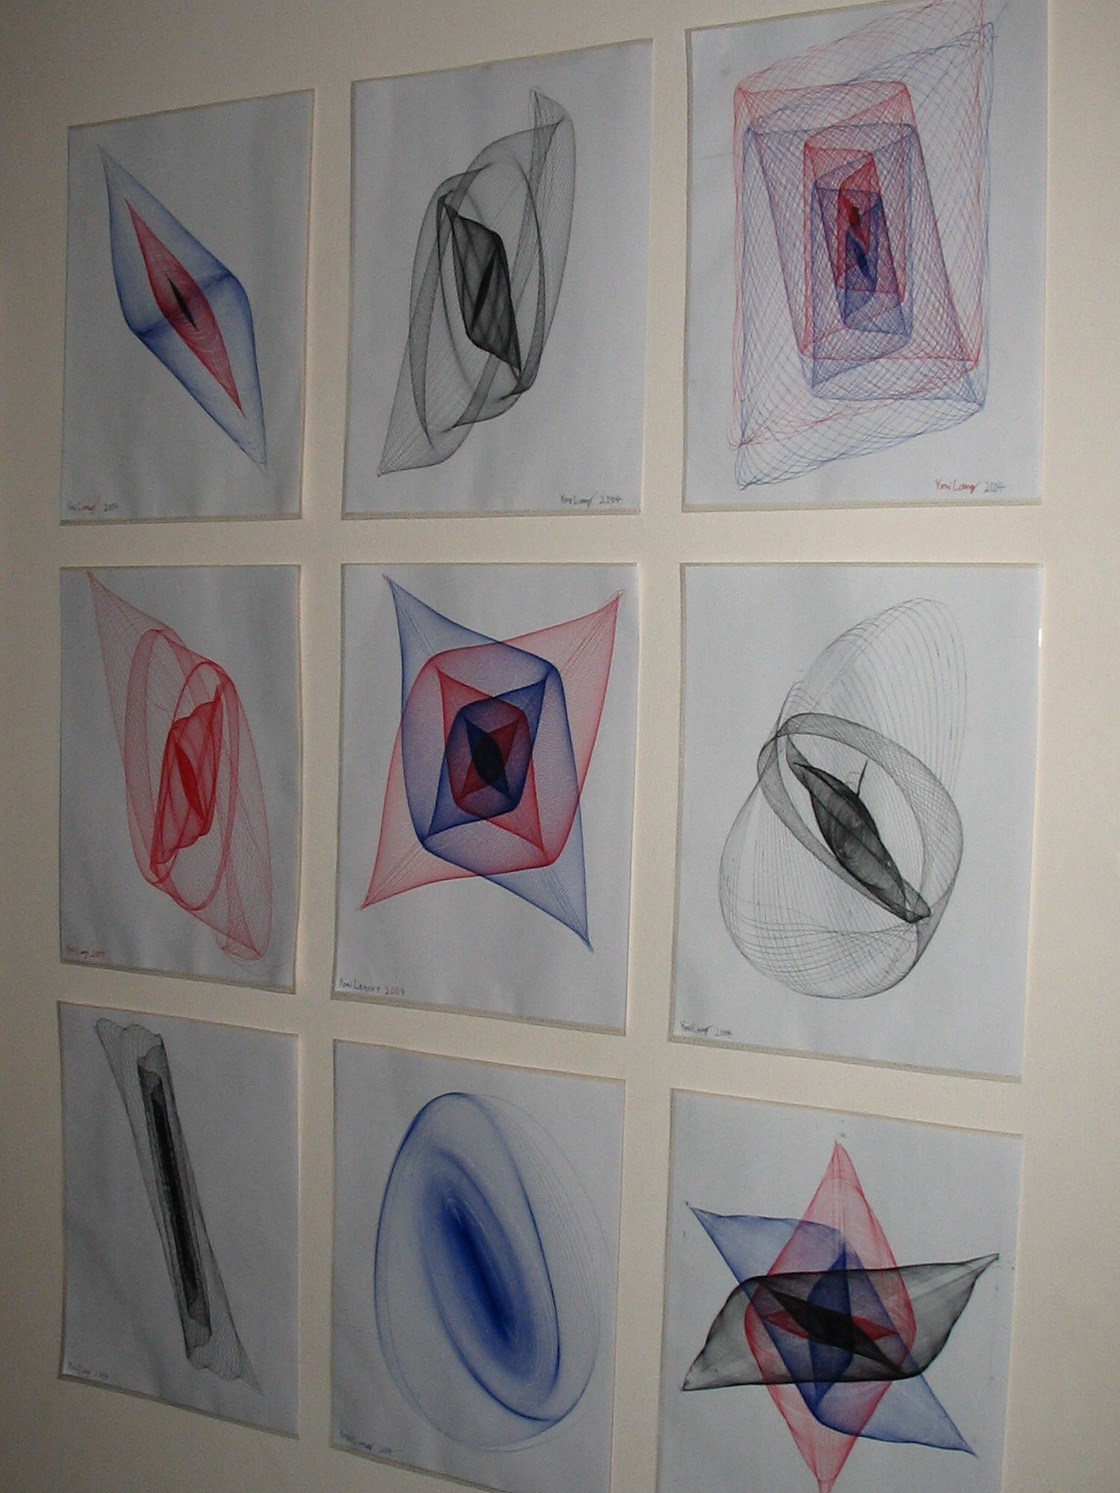
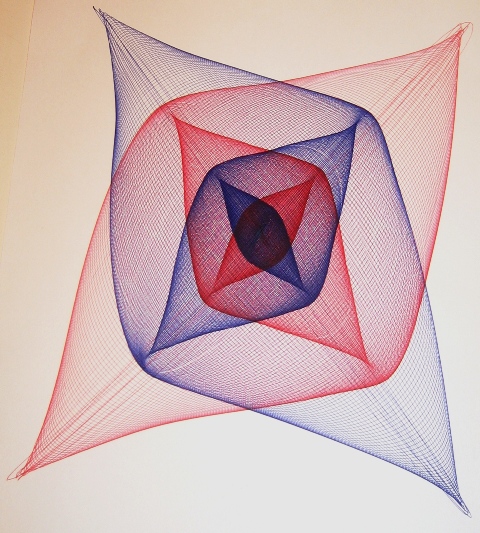
What I call a “third oscillation,” is found in the twisting of the pendulum shown by the blue arrows in the graphic at the right and determined by the moment of inertia of the barbell along a vertical axis. The third oscillation was tuned to have a period that was a multiple of one of the other periods to make for a good drawing.

Friction between the pen and paper is assumed to be the main source of damping.  Since the friction force is independent of velocity damping will be constant.

A More Mathematical Analysis:

Call the red arrows the y axis and the green arrows the x axis.  Since the pendulum is oscillating approximately harmonically it can be described by the following parametric equation:
b=(close to zero); multiply by (k*t) for damping; a=amplitude;
x(t)=a*cos(t*b)(k*t)
y(t)=a*cos(t)(k*t)

Some people say the damping should be logarithmic.  I think it should be linear because the main source of damping (kinetic friction of the pen sliding on the paper) is constant regardless of amplitude and 
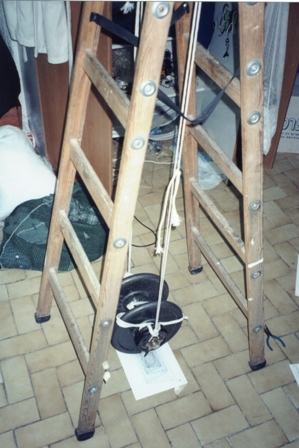
velocity.  I cannot calculate the damping by the ladder.
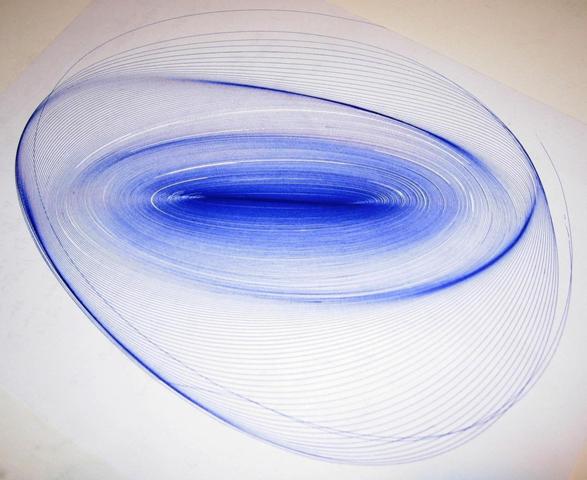
Note: It's a good idea to have 't' go from negative to zero.  This way the thing slows to a stop.

That is the type of pictures drawn in the museum.  My contraption was more complicated because it also oscillated along the blue arrows.  Unlike the others, the period of this oscillation depends mostly on the moment of 
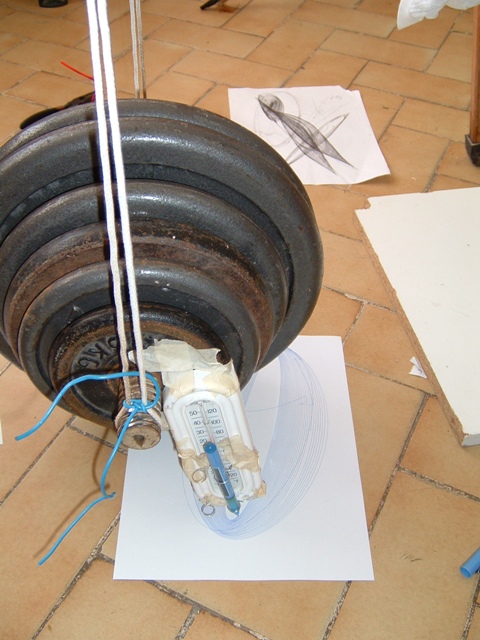
inertia of the weights along a vertical axis.  I could change 'I' easily and very precisely by moving some smaller weight further or closer to the center (see the gray weight in the first figure).  It was convenient to set this oscillation to be around twice the other oscillations.

Assuming that the Blue arrow oscillation is harmonic (like a normal pendulum it is not, but very close at small angles) then the angle 's' that the pen will move is:
f=(constant, depends on 'I', f is almost 2);  j=damping (Note: this motion was somewhat less damped by the ladder than the green and red, so it gets its own constant);
s(t)=cos(t*f)*(j*t)
When the green and red arrows are zero:
r=(distance from center to pen); m=(amplitude);
y(t)=r*sin(cos(t*f)(j*t))m
x(t)=r*cos(cos(t*f)(j*t))m

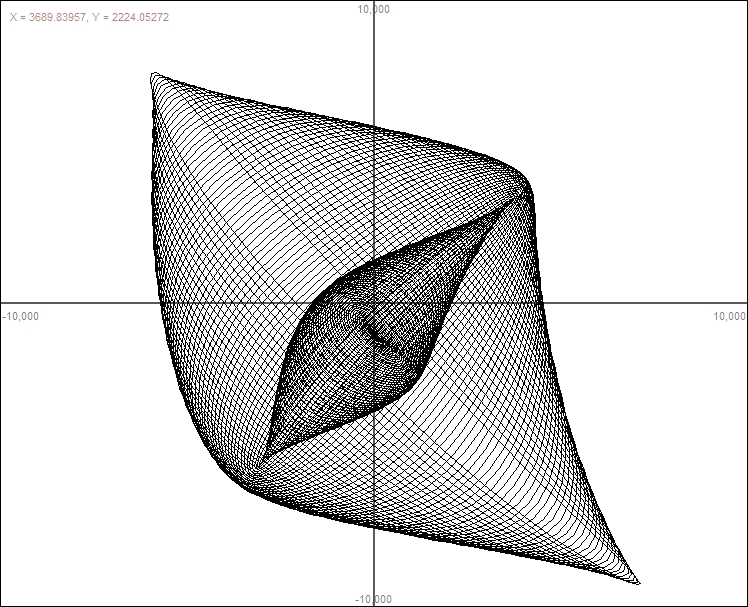
To get the complicated motion simply add these to the original parametric formula.
x(t)=a*cos(t*b)(k*t)+r*cos(cos(t*f)(j*t))m
y(t)=a*cos(t)(k*t)+r*sin(cos(t*f)(j*t))m

So to get different output, I simply tied the string to a different weight (thus changing 'b') or moved the small weight around (changing 'f').


I could also push and twist harder or softer (changing a, and m respectively).  Another way to change the output without changing the string arrangement was to change the direction of the initial push (ranging between tangent to the center and directed at the center).  This simply adds two constants (h,g) on the inside of the parenthesis, one for initial twist position/velocity and another for initial amplitude/velocity.
x(t)=a*cos(t*b+h)(k*t)+r*cos(cos(t*f+g)(j*t))
y(t)=a*
cos(t+h)(k*t)+r*sin(cos(t*f+g)(j*t))

Calculating all these constants would have been rather difficult considering that the only measuring device I had was a thermometer.  Instead I just guessed from the way the graphs looked what the parameters were and tweaked accordingly.

Here is an example.
With 2 Axis's of motion (red and green): x(t)=cos(t*1.03)*t
y(t)=2*cos(t)*t

or

x(t)=cos(t*1.005)*2*t
y(t)=cos(t)*2*t

With 3 Axis's of motion (red green & blue)

x(t)=cos(t*1.01)*2*t-25*sin(cos(t*2.06)*0.001*t)*5
y(t)=cos(t)*2*t+25*cos(cos(t*2.06)*0.001*t)*5

Procedure

  1. To raise the heavy weights to the exact height of the pen, the legs of that ladder could be slowly pushed together, with amazing leverage, raising the weights hanging from it to very precise heights.
  2. Fresh paper was taped to the floor and the pen put in place.
  3. Once set up, a short push was given to the pendulum; moments later, the pen was dropped to the paper.  It would swing for about 10 minutes before coming to rest in the center.

Parameters I Could Change

  • The amplitude of the push and the amount of weight can be changed to decrease or increase the time before friction stops the motion.
  • The push could initially direct the pendulum in approximately a straight line, an ellipse, or anything in between.
  • The strings could be tied to weights of different heights to adjust the difference in frequencies.  Tying with the green string in figure 1, will result in a longer period than tying with the blue string.
  • The amplitude and initial conditions of the third oscillation (the blue arrows in figure 3) could be set in the same way as the previous two.
  • The frequency could also be easily tweaked by sliding the weights along the barbell, changing its moment of inertia.  It was convenient to set this frequency to about twice the others, but with an extra barbell I managed to get them about equal.  This made very different looking graphs.

Discussion

  • The assumption of linear damping is not completely correct. The swaying ladder and possibly air resistance damped the motion as some function of the amplitude.
  • The assumption of simple harmonic motion is not a perfect model for a pendulum. It is only a good approximation only for small amplitudes. The same applies to the third oscillation.
     
  • In the earlier models with low weight, and a considerable frequency differences, the lines were spaced far enough apart that the third oscillation could be largely ignored.  Upon increasing to 45 kg, the lines were so closely spaced they overlapped no matter how carefully I tried to minimize its motion.  By setting this frequency to match one of the others, the same error margin is still there, it is only very difficult to see.
     
  • I say it was hung from two strings but in reality it was hung from two string loops, making four.  Since I bound the two strings together at the base and top, I thought it would not make much of a difference.  In general though, the frequency difference would lessen slowly over time as the knots loosened.  This is because the motion on each axis became more similar.  This increased the frequency ever so slightly, but the effects were quite noticeable in the graph.  For example, the central drawing below and the bottom center drawing were made with the same arrangement, but at different times.


More pictures of the drawings


Click for larger Version.


Some Computer Graphs


More photos of the apparatus:


While Drawing


Close up while drawing


I attached to pens at the same time here.


A setup with less weight so damping had a larger impact.


A setup with a large difference in frequencies


A setup a twisting frequency (f) set to equal the back and forth frequency instead of being double it. The pictures it drew with this configuration were significantly different but not particularly prettier.

More projects →