Graphing the ecliptic
On this map, dark areas are where it is night, light areas are where it is
day.
The red curve is a weird once because the Earth is a sphere that's axis is
tilted.
I found the equation for the curve, graphed it then added it to the map.


Discussion:
Ecliptic:
If the red line were drawn on a globe, it would just be a
great circle dividing the Earth exactly in half. (Assuming that the Earth
is a sphere, and the suns rays are parallel.) Since the Earth's axis is
tilted, the entire south pole and Antarctica is in sun during our winter as you
can clearly see on the map.
The angle that the earth is tilted relative to the sun is called
the Ecliptic, it is also
phi in my formula. This angle changes with the seasons. At the time the
date was November 5, the ecliptic then is about 15 degrees, or around
1.3 radians (almost any globe with tell you this). t in my formula is time in days. It just
shifts the red graph over the map as Earth spins. In 1 day, it will go 360
degrees or 2(pi) radians.
Map Projection:
I found the equation for a map with no projection, that means that the (x, y) coordinates on the map correspond to (longitude, Latitude) coordinates on the globe. (To get equations for other map projections, simple plug in the equation for theta into the given maps equation for y(theta).
Finishing:
Once I had the shape of the curve (with the current date's ecliptic value), I shrunk my graph until the poles (y=-pi/2,pi/2) and the ends of the Earth (x=-pi, pi) lined up with the right spots on the Earth on the map. Now that I had the size right, I shifted everything over to the right until it lined up (I could have played around with different values of 't' until they lined up, but this was was much easier. I could have also found the exact time for midday at the equator, and calculated from there, but I didn't think of it then).
Seasons:
At right is a couple graphs of the equation with
different values for phi. Phi=[-Ecliptic, Ecliptic]
Each line represents the Night-Day dividing line for a different time of
year. The blue lines represent winter for me in the Northern
Hemisphere and summer for anyone in the Southern Hemisphere.
Equator:
Notice that nodes at the equator, that means the length of the day on the equator remains constant no matter what time of year.
Solstice & Artic Circle:
The maximum of the lowest blue line (blue line representing the winter solstice) is the boundary for the artic circle and likewise for the minimum of the corresponding red line at the summer solstice.
Equinox:
The imaginary line in between the red and blue lines. This is when the sun right above the equator at all times. The earths axis is perpendicular to a line drawn from it to the Sun. Days equal nights and the equation becomes a square wave.
Tracking satellites
This is a map of the path of a Satellite. Each point represents the point on earth directly below the satellite at a given time.

(Side point: If its in a circular orbit i.e. constant speed, Why do the points
get further spaced apart near the poles? hover mouse over picture for
answer.)
Satellites travel in *great circular orbits, the kinds of circles the equation
discussed earlier deals with. In other words, if the Earth were not spinning (relative to
the satellite) then we would get the same boring graph as before. Adding
motion to the earth will make things much more complicated though.
This relationship is easiest to put down in parametric form:
x(t)=arctan(cos(Phi)*tan(a*t)) ± (1/4)*t
y(t)=arcsin(sin(Phi)*sin(a*t))
Notice: . . . ± (1/4)*t this takes into account the earth
spinning 360 degrees in 24 hours or 1440 minutes. it is really reduced from
± (360/1440)*t. + if the Earth is spinning away from the satellite, - if its
traveling with the satellite.
a*t is how fast the satellite is going around earth, like its angular speed,
this depends on how far up it is.
Finding Phi:
This particular picture was taken from The Champ Sattelite's Home Page. It is used to map Earth's gravitational and magnetic fields. I researched the satellite on heavens-above.com (Champ satellite detail) and found the value of Phi is 87.2 degrees.
Finding 'a':
Looking it up on the website we find that a=3.920632233.
plugging in Phi=87.2, a=3.92 we get:
x(t)=arctan(cos(87.2)*tan(3.92063*t))+(1/4)*t
y(t)=arcsin(sin(87.2)*sin(3.92063*t))
Dot Mode:
I tried graphing it in Dot Mode, t-step at 5 min, the dots were spaced the
same as this graph, as expected.
The "Previous" black line,
flows right into the "Predicted" blue line in continuation of the map, just like
it should. Click the picture or
here, to get an unbroken version.
More Applications
Astronomy:
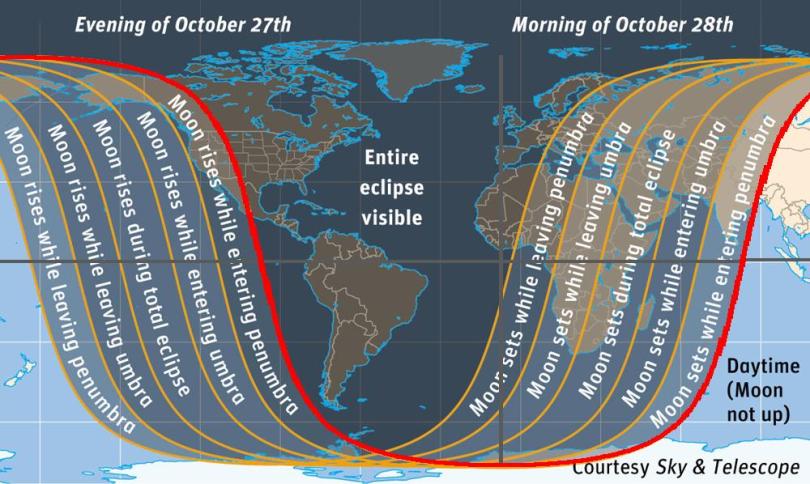
This is a map of where an eclipse is visible. They yellow lines were there originally. I added the Red line on top of a yellow line. It is such a nice model that it covers they yellow line completely.
Since the moon's orbit is parallel to the ecliptic, it's rising and setting follows the same pattern as the sun. Now the eclipse is only visible when the moon is visible, just like it is day only when the sun is visible. So its the same exact curve! The Earth turns a bit between different stages of the eclipse so the moon rises and sets in different places during that interval making it no longer visible or newly visible. That's why you have different curves for different times.
Flight Paths:

Ever looked at those in-flight
magazines airlines give you? Usually they have a page with map of the
flight paths between all the cities they service. They are not
straight lines. Why?
The shortest distance between two points on a sphere is a great circle. For this reason most flight
paths of airplanes approximately follow great circles. (They'll sometimes go out of the way to avoid headwinds or to fly by a city. Check out the Middle East, they basically fly circles around Saudi Arabia,
Iraq, Iran . . .)
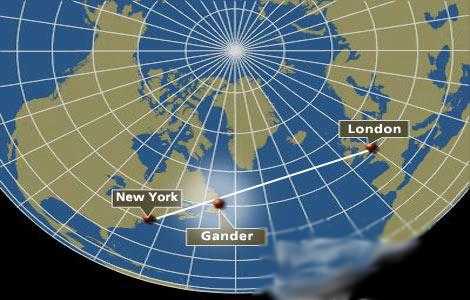
The map projection on the left shows the great circle path between New York
City and London. It is a curve described by the equation described
above. The
graphic to the right shows the same path but with a different map projection
so the path appears as a straight line.