Dynamic visual representation of live worldwide market data
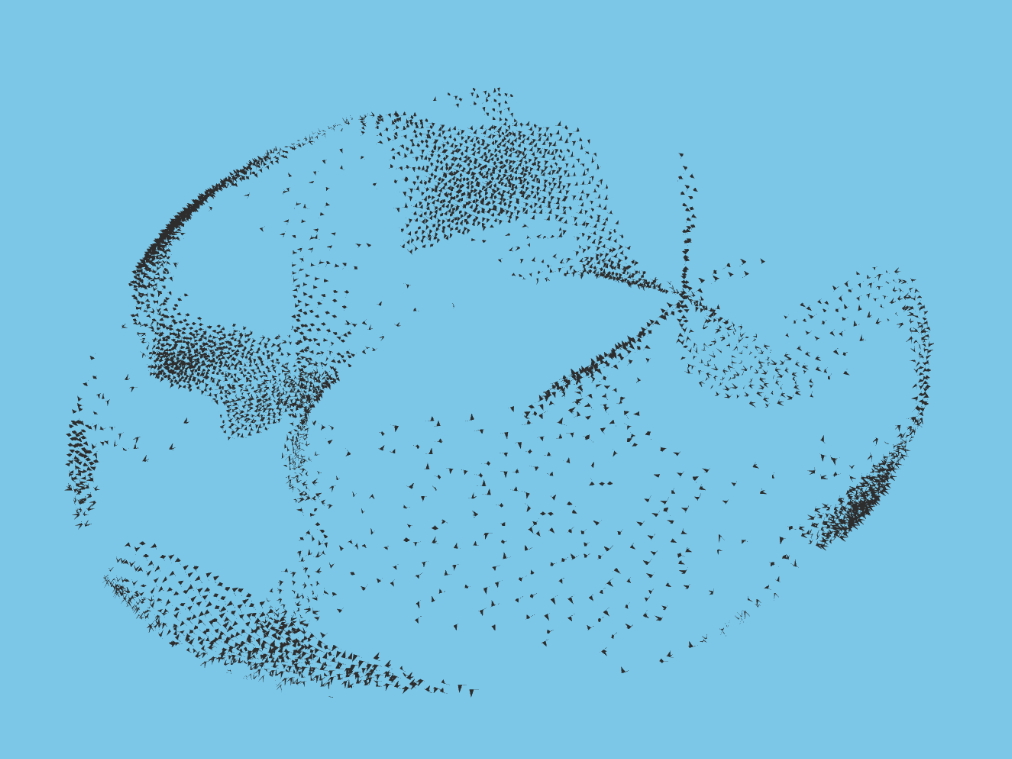
TAD Associates hired me in 2019 to help them build an artistic data visualization for stock market movements worldwide. Working together we settled on 21 ETFs from around the world each represented by a swarm of particles called “boids”(bird-like objects). I remixed and combined a few GPU-Shader algorithms for controlling particle motion to create patterns parameterized by live data from the market.
A similar algorithm can be seen here, where the pattern of boids is forced briefly into a torus shape. Torus boidflow pattern. This algorithm was based on this simulation. In development I used this awesome vector field explorer, and based on a challenge created this American flag vector field.
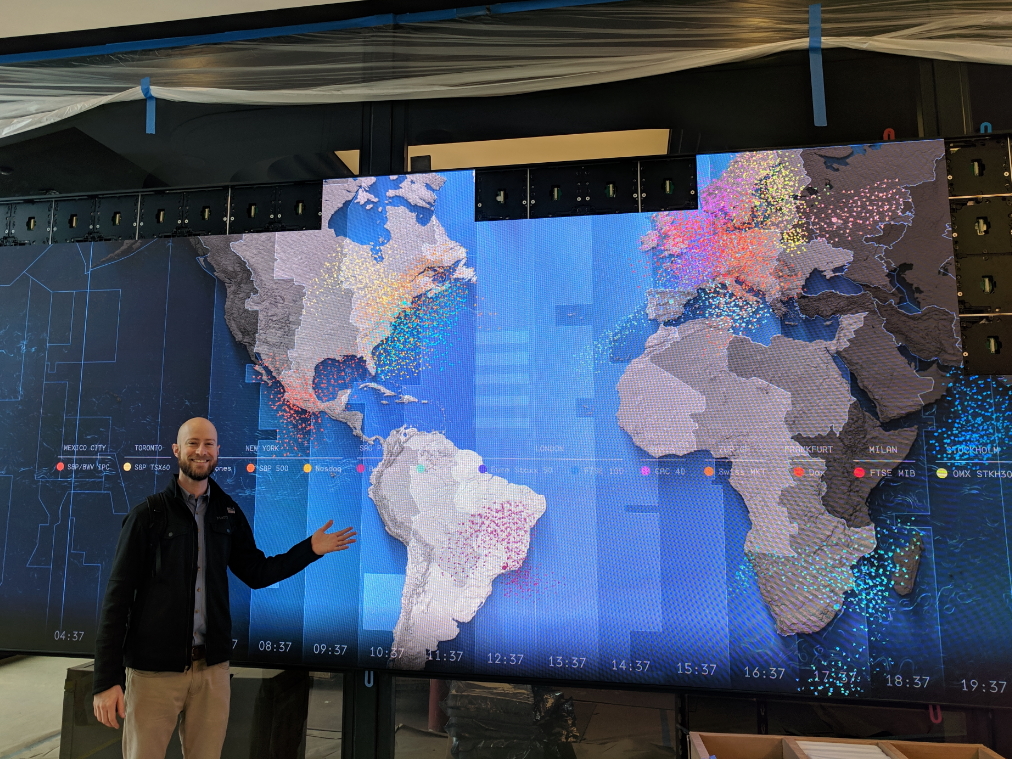
This is me in front of the wall when the screen was still mid-way being installed

This is the completed wall in the lobby.

This is a photo of the building in Hudson Yards NYC, and a photo from their balcony.